Brand Loyalty Survey for Subscription Media Streaming Services
This is an online dashboard that provides a monthly snapshot of SVOD's growth and positioning. It enables you to understand "what's happening now in the market" based on values such as penetration (awareness, usage), acquisition and retention potential, media exposure (TV, digital), brand image, and outflow analysis.
Analysis Examples
Netflix remains No. 1 for “Depth of Exclusive Programs”, Disney+ makes big leap, battles with Amazon for 2nd place
For more information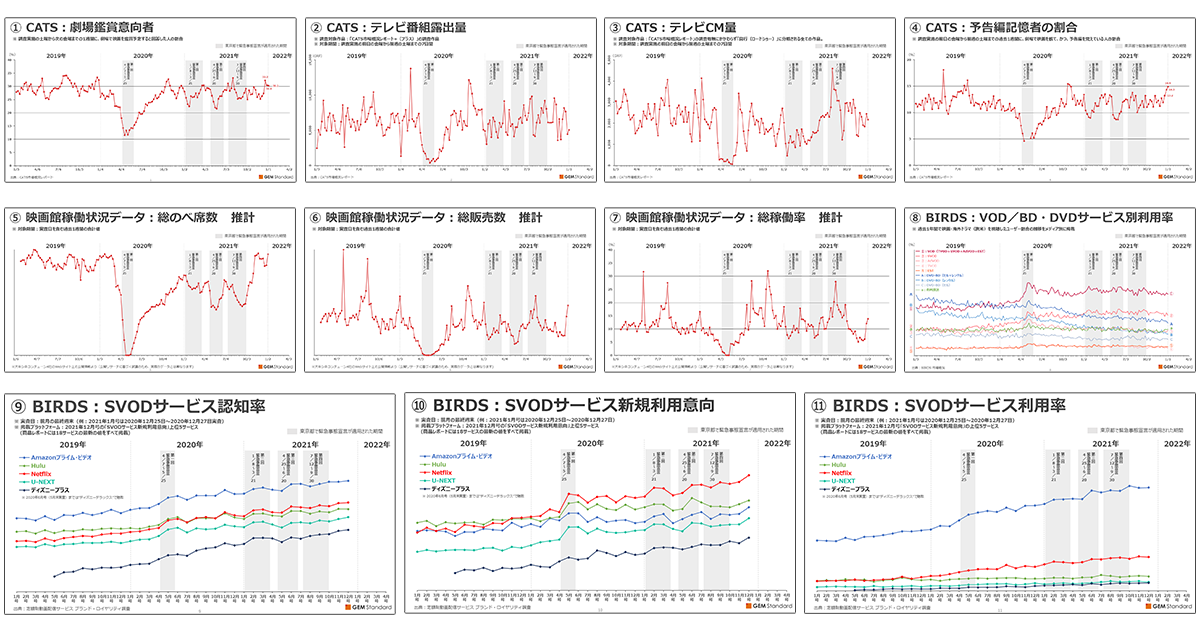
[Members-only & Japanese] Penetration data for SVOD (January 2019-December 2022)
For more information18 services surveyed covering all major services in Japan
- ABEMA Premium
- Anime Hodai
- Apple TV+
- DAZN
- Disney+
- DMM TV
- Docomo Anime Store
- FOD
- Hikari TV Video Service
- Hulu
- J:COM STREAM
- Lemino
- Netflix
- Prime Video
- Rakuten TV
- TELASA
- U-NEXT
- WOWOW On Demand
Monthly tracking survey to monitor changes in the market
Effective usage by business
Distributors
-
Measuring Promotional Effectiveness
- Monthly surveys are conducted on brand penetration (Awareness, Trial use, Use, Intention to Start Using Service, etc.), brand loyalty, brand image, and subscription and cancellation status for each service. Data can be referenced from one year prior to the start of the contract month, making it ideal for trend analysis as well as for measuring the effectiveness of promotional measures through comparative analysis with media exposure. Strategic planning for user acquisition
- By quantitatively analyzing the impact of brand image on intention to start using a service and the reasons for subscriptions and cancellations, we obtain insights into which points to strengthen and promote to effectively acquire users when compared to other companies.
Content Holders
-
Understanding service features
- Using brand penetration (Awareness, Trial use, Use, Intention to Start Using Service, etc.) and brand image, market positioning and points of differentiation from competitors can be analyzed to ascertain the superiority of each service. Compatibility analysis of content and services
- Analyzing the usage of each service by gender and age group, as well as by viewing content, it is possible to understand the trends and preferences of users and find a distribution service suitable for the content owned by content holders
Advertising Media
-
Allocation of media exposure (TV, digital) and understanding of ad placement timing
- We conduct monthly surveys of the amount of exposure for each service on TV (commercials, in-program) and digital (Twitter, Youtube, web news, blogs). By comparing past exposure trends and the amount of exposure for each service, it can be used for strategic planning of exposure allocation and timing of advertisement placement. Building promotions based on the features of each service
- Based on the utilization status of each service by gender and age group, as well as the utilization status of viewing content, the data can be used to develop promotional strategies that take advantage of the features of each service. It is also possible to measure the effectiveness of the service by comparing it with the level of penetration.
A variety of analysis functions by online dashboards
The "Brand Loyalty Survey for Subscription Media Streaming Services" is available as an online dashboard. This allows you to use a variety of analytical functions that were not available in the PDF report.
Drill-down analysis to grasp segment composition ratios
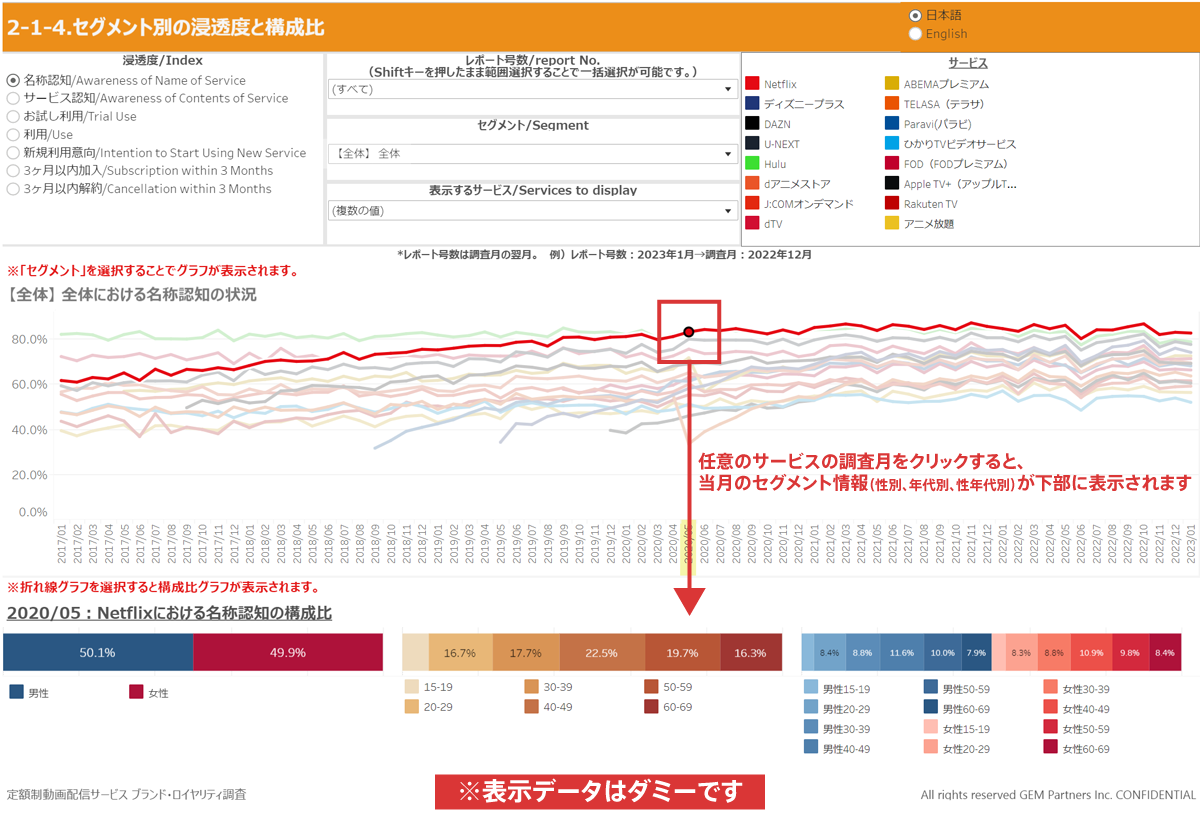
(Click to enlarge)
While viewing penetration trends, clicking on any month's value will display the segment for the current month (by gender, age, and sex) at the bottom of the page
reference menu: 2-1-4. Media Exposure and Index Status
Free to select the indexes you wish to compare
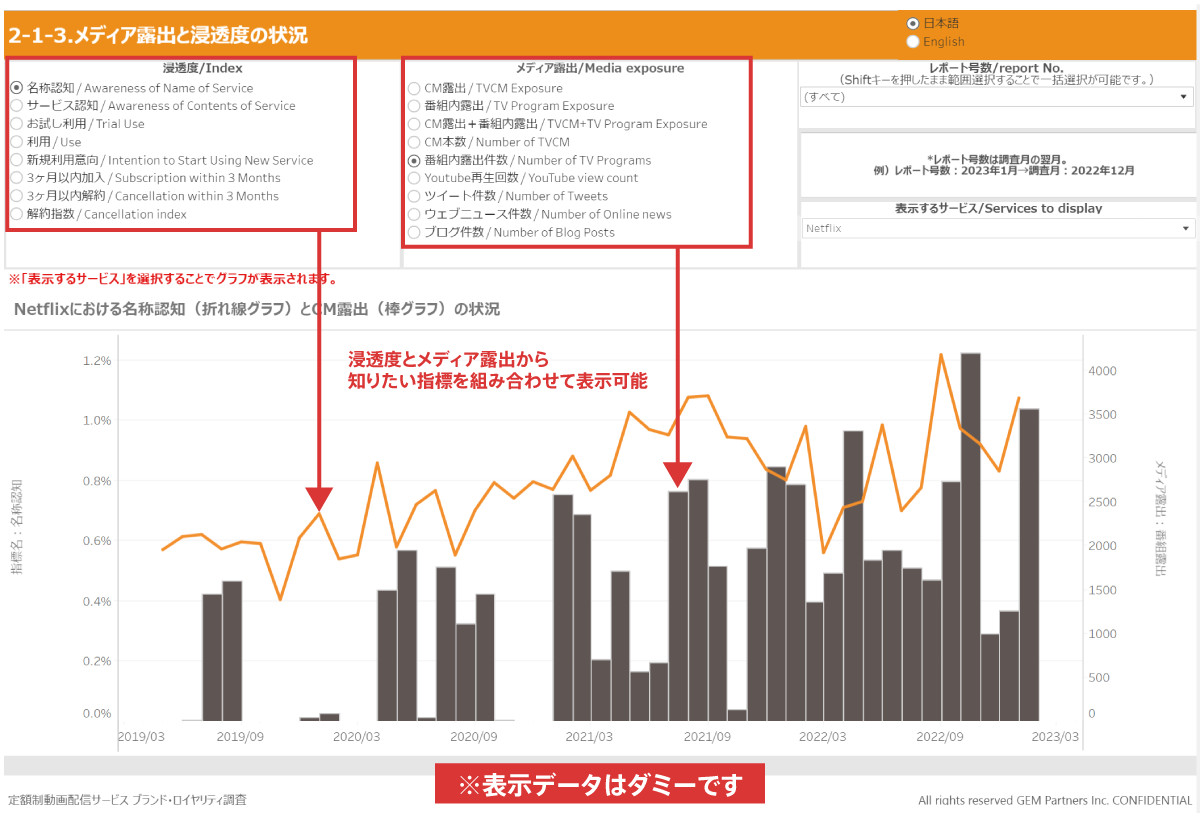
(Click to enlarge)
When measuring effectiveness by comparing penetration and media exposure, you can select any index you wish to compare from the dashboard.
reference menu: 2-1-3. Status of media exposure
Aggregation of multiple months' data is possible
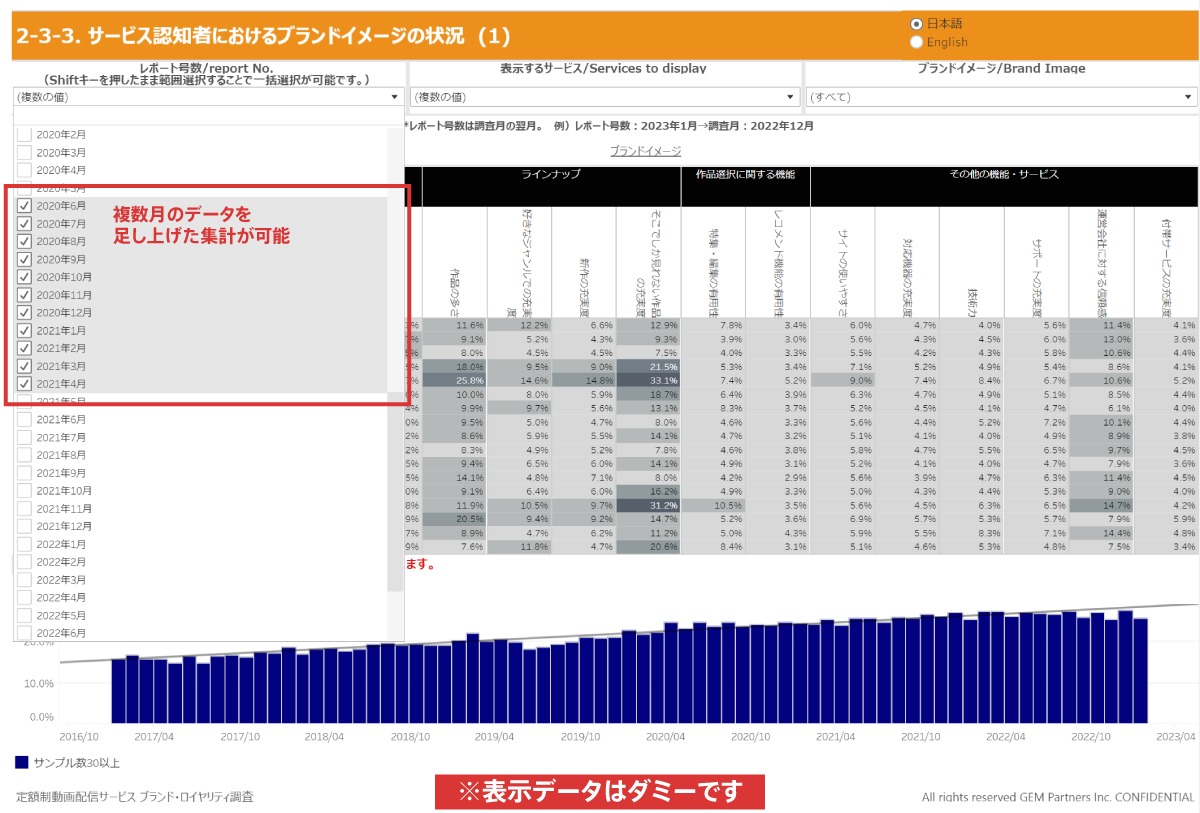
(Click to enlarge)
If you want to review the aggregate values for any given period, or if the sample size is insufficient for a single month, you can add up the data from multiple months.
reference menu: 2-3-3. Status of Brand Image in Those Aware of Service (1)
Switching function between Japanese and English
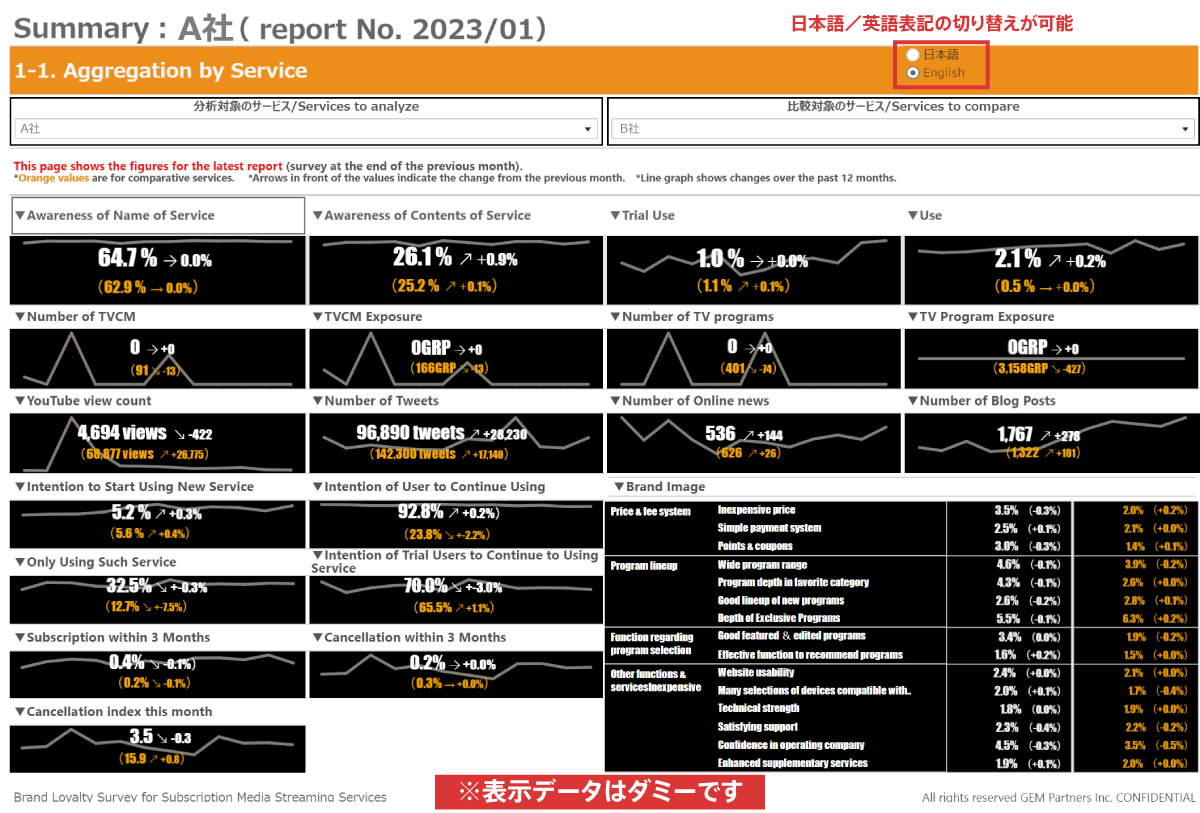
(Click to enlarge)
The switching button between "Japanese" and "English" is located on the upper right corner of the dashboard. You can easily switch between the two languages depending on the language you wish to use.
reference menu: 1-1. Aggregation by Service
Dashboard Menu
- About this Survey
- Cover
- Survey Outline
- Definition of Index
- 1. Summary
- 1-1. Aggregation by Service
- 1-2. Aggregation by segment (Index)
- 1-3. Aggregation by segment (Brand image)
- 2-1. Brand Analysis: Penetration
- 2-1-1. Status of each index(All)
- 2-1-2. Status of each index(By Service)
- 2-1-3. Status of index by segments
- 2-1-4. Status of media exposure
- 2-1-5. Media Exposure and Index Status
- 2-1-6 *Japanese Only
- 2-1-7. Index and composition ratio by segment
- 2-1-8. Status in composition ratio at each Index
- 2-1-9. Comparison of service composition ratio
- 2-1-10. Content you usually watch regardless of the target service (1)
- 2-1-11. Content you usually watch regardless of the target service (2)
- 2-1-12. Method you usually watch regardless of the target service (1)
- 2-1-13. Method you usually watch regardless of the target service (2)
- 2-2. Brand Analysis: Potential for Acquiring New Users
- 2-2-1. Overlap of Users Who Intend to Start Using Service
- 2-2-2. Reasons for Intention to Start Using New Service (1)
- 2-2-3. Reasons for Intention to Start Using New Service (2)
- 2-2-4. Reasons for Intention to Start Using New Service (3)
- 2-2-5. Reasons Not to Start Using New Service (1)
- 2-2-6. Reasons Not to Start Using New Service (2)
- 2-2-7. Reasons Not to Start Using New Service (3)
- 2-2-8. Intention of Trial Users to Continue to Using Service
- 2-3. Brand Analysis: Brand Image
- 2-3-1. Status of Brand Image in All Respondents (1)
- 2-3-2. Status of Brand Image in All Respondents (2)
- 2-3-3. Status of Brand Image in All Respondents (3)
- 2-3-4. Status of Brand Image in Those Aware of Service (1)
- 2-3-5. Status of Brand Image in Those Aware of Service (2)
- 2-3-6. Status of Brand Image in Those Aware of Service (3)
- 2-3-7. Influence of Brand Image on One's Intention to Start Using New Service (1)
- 2-3-8. Influence of Brand Image on One's Intention to Start Using New Service (2)
- 2-3-9. Influence of Brand Image on One's Intention to Start Using New Service (3)
- 2-3-10. Brand image positioning for each service
- 2-3-11. Positioning of Service by Brand Image
- 3. Loyalty Analyses
- 3-1. Users' Intention for Continue to Using Service
- 3-2. Segment composition ratio of users who intend to continue
- 3-3. Status of Combination Use
- 3-4. Only Using Such Service
- 3-5. Only Using Such Service composition ratio among users
- 4. Inflow Analyses
- 4-1. Inflow Source of Subscriber(All)
- 4-2. Inflow Source of Subscriber(By Service)
- 4-3. Services Provided by Inflow Source
- 4-4. Reasons for Subscription (1)
- 4-5. Reasons for Subscription (2)
- 4-6. Reasons for Subscription (3)
- 5. Outflow Analyses
- 5-1. Cancellation index this month
- 5-2. Outflow Destination of Those Who Cancelled Service (All)
- 5-3. Outflow Destination of Those Who Cancelled Service (By Service)
- 5-4. Services Provided by Outflow Destination
- 5-5. Reasons for Cancellation(1)
- 5-6. Reasons for Cancellation (2)
- 5-7. Reasons for Cancellation (3)
- 6. Comparison with competing services
- 6-1. Comparison of Awareness of Name of Service
- 6-2. Comparison of Awareness of Contents of Service
- 6-3. Comparison of Trial Use
- 6-4. Comparison of Use
- 6-5. Comparison of Intention to Start Using New Service
- 6-6. Comparison of Intention of Trial Users to Continue to Using Service
- 6-7. Comparison of Intention of Users to Continue to Using Service
- 6-8. Comparison of Only Using Such Service
- 6-9. Comparison of Subscription within 3 Months
- 6-10. Comparison of Cancellation within 3 Months
- 6-11. Comparison of Cancellation index this month
- 6-12. Comparison of Brand Image
- 6-13. Comparison of Number of TVCM
- 6-14. Comparison of exposure of TVCM
- 6-15. Comparison of Number of TV Program
- 6-16. Comparison of exposure of TV Program
- 6-17. Comparison of YouTube view count
- 6-18. Comparison of Number of Tweets
- 6-19. Comparison of Number of Blog Posts
- 6-20. Comparison of Number of Online news
Survey overview
| Product Name | Brand Loyalty Survey for Subscription Media Streaming Services |
|---|---|
| Survey method | Internet survey |
| Date of survey conducted/updated | Surveys are conducted on the last weekend of each month (Friday, Saturday, and Sunday). The relevant data is updated on the 15th of the following month *If the 15th falls on a Sunday or holiday, the data is updated on the next business day. |
| Survey Target | Male/female of ages between 15 and 69 who are living in Japan |
| The number of respondents | Nearly 10,000 people each time |
Price
¥3,300,000/year(tax included)
Term of contract: January-December (with data updated 12 times a year)
* Subscriptions can be started during the term on a month-to-month basis. Please contact us for details.
| Services included in the contract fee |
|
|---|---|
| Online Dashboard |
|
| Japanese version report/Aggregate values by segment( |
|
| option |
|